


For a presentation I am giving at the JEA/NSPA Spring National High School Journalism Convention April 26th, I needed to figure out how to do Infographics using Google tools. I’ve long been a fan and user of Google Draw, but I have not tried to actually make an infographic before. I found it surprisingly easy to make the necessary elements right in Google Draw.
There are other tools out there to create Infographics, but there are some distinct advantages to using Google.
- I use Google for almost everything so using Google Draw keeps all of my documents right in Google Drive. No having to track down which program or where the file is at.
- If I need to make changes or edits it is easy to just pull up the infographic in Google Drive and edit, any embeds are automatically updated.
- Collaboration! Students can collaborate together on the same infographic at the same time. Teacher can be shared on the infographic as well.
- Embedding. Go to File->Publish to the Web and start publishing. Grab the embed code and embed it into your website.
- Free and easy to download as image file or PDF. Some services charge money for this.

- Easier for students to turn in the infographic when it is in Google Draw. Share the drawing with the teacher or turn into a class folder.

Click Here to link to the Google Doc of the below tutorial.
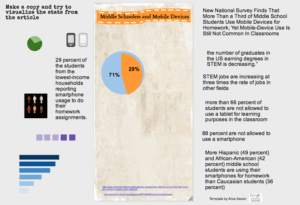
Sample Infographic I made for iOS users thinking of switching to an Android device.


6 thoughts on “Have Students Create Infographics Using Google Draw”
I’m no spreadsheet wizard, but can’t you just create the data in a Google Spreadsheet and then have the results display in a pie chart or bar graph and insert that into the infographic. If you did that with a Google Form couldn’t you have an infographic that had changing data graphics as people answered your Google form?
This is more cool
PS- how you created the person graphic is cool. I could see a ton of uses for that process.
Thank you, I was pretty proud of myself. Took me awhile to figure it out 🙂
I recommend using Google Draw for the final version of the infographic, but not creating the charts and graphs using draw. The students should be using the tools to analyze data and then creating the charts in spreadsheets or on the NCES Create-a-Graph site or in Chart Chooser. The ability to do layer-based image editing, moving things around, using Word Art, and the ability to cite the research sources easily is why you would want to use Google Draw. I have had teachers use it to create their final copies in my workshops after collecting their assets.
I highly grateful, thanks for the effort.